Gold and silver have long been cherished not only as symbols of wealth but also as vital assets in the financial markets. Investors and traders often turn to these precious metals during uncertain economic times, using them as safe havens when stock markets become volatile. One of the most crucial aspects of trading gold and silver is identifying their resistance and support levels, which helps traders make informed decisions. In this article, we’ll discuss how to pinpoint these key levels, explore the current rates of gold and silver, and dive into the broader economic factors that influence the movement of these metals.
What Are Resistance and Support Levels?
Before we dive into the technical details, let’s clarify what resistance and support levels are. These terms come from technical analysis and represent the price points at which a particular asset—like gold or silver—tends to reverse its direction.
Support level is a price point where demand for the asset is strong enough to prevent its price from falling further. Essentially, it’s the “floor” of the asset’s price.
Resistance level, on the other hand, is where selling pressure is strong enough to cap any upward momentum. It’s the “ceiling” for the asset’s price.
Identifying these levels is crucial because they allow traders to decide when to buy (at support) or sell (at resistance). These points also act as indicators for future price movements.
Comparision in between Gold,Silver and Nifty 50 rates in different years.
| Gold per 10 gm | Silver per kg | Nifty 50 | |
| 1985 | RS.2130 | Rs.3,955 | Rs.- |
| 1990 | Rs.3200 | Rs.6,463 | Rs.- |
| 1995 | Rs.4140 | Rs.6,335 | Rs.908 |
| 2000 | Rs.4400 | Rs.7,900 | Rs.1,263.5 |
| 2005 | Rs.7000 | Rs.10,675 | Rs.2,836.5 |
| 2010 | Rs.18500 | Rs.27,255 | Rs.6,134 |
| 2015 | Rs.26343.5 | Rs.37,825 | Rs.7,946.9 |
| 2020 | Rs.48720 | Rs.63,436 | Rs.13,981 |
| 2024 | Rs.71510 | Rs1,00,000 | Rs.26,300 |
Current Market Conditions and Prices (As of 22/10/2024)
As of today, the price of gold hovers around ₹58,000 per 10 grams in India, while silver trades at approximately ₹72,000 per kilogram. Both metals have been in a relatively volatile phase due to global economic conditions. The uncertainty around the geopolitical situation in the Middle East and rising inflation fears have boosted demand for precious metals.
Gold and silver have witnessed fluctuations due to a mix of global demand-supply imbalances, the strengthening of the U.S. dollar, and fluctuations in interest rates.
How to Identify Resistance and Support Levels for Gold and Silver
Now that we know the basics, let’s break down how you can identify these levels for gold and silver:
1. Use Historical Data
One of the easiest ways to identify resistance and support levels is by analyzing historical price data. By looking at charts over the past few months or years, you can identify price points where gold or silver has struggled to move past (resistance) or has bounced back from (support).
For example:
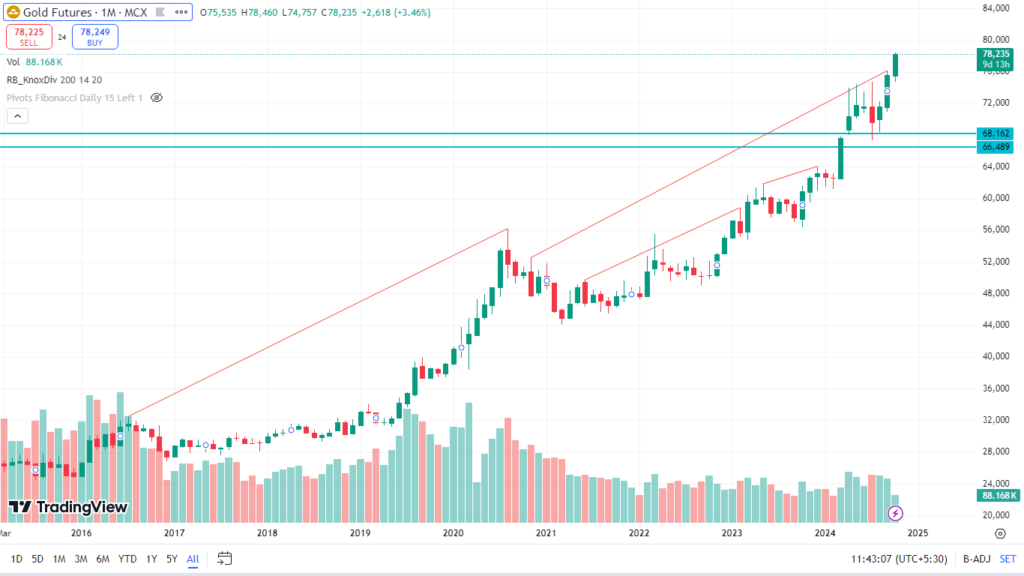
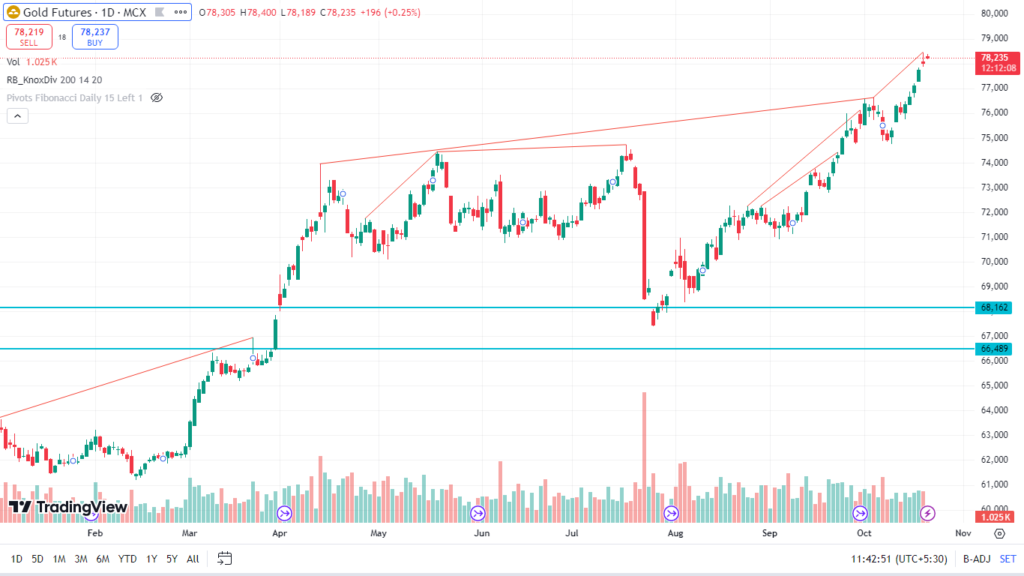
For gold, recent charts indicate a resistance level around ₹60,000 per 10 grams, as it has repeatedly struggled to break past this point.
The support level for gold is currently around ₹56,500, as it has consistently rebounded when it neared this price.
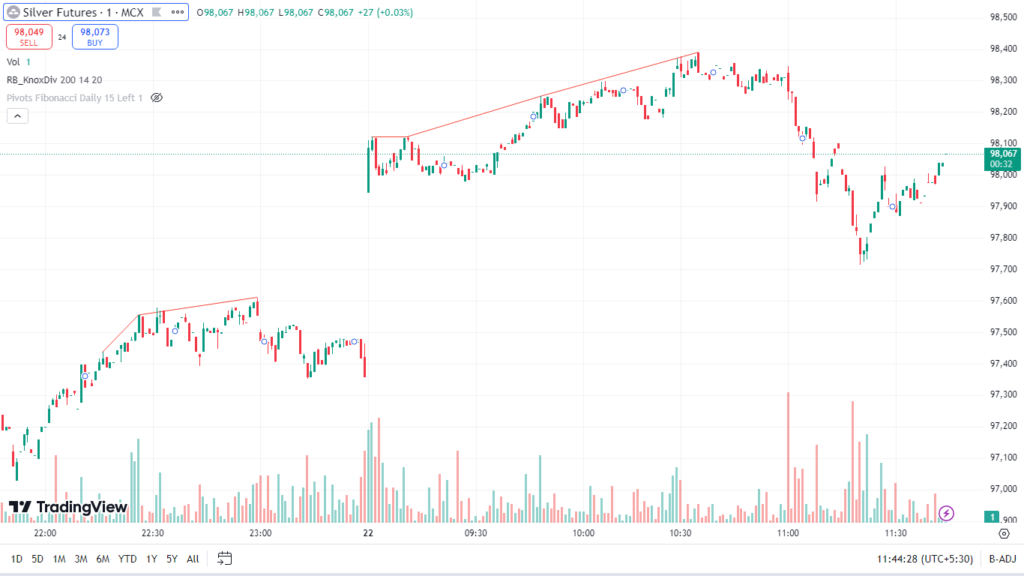
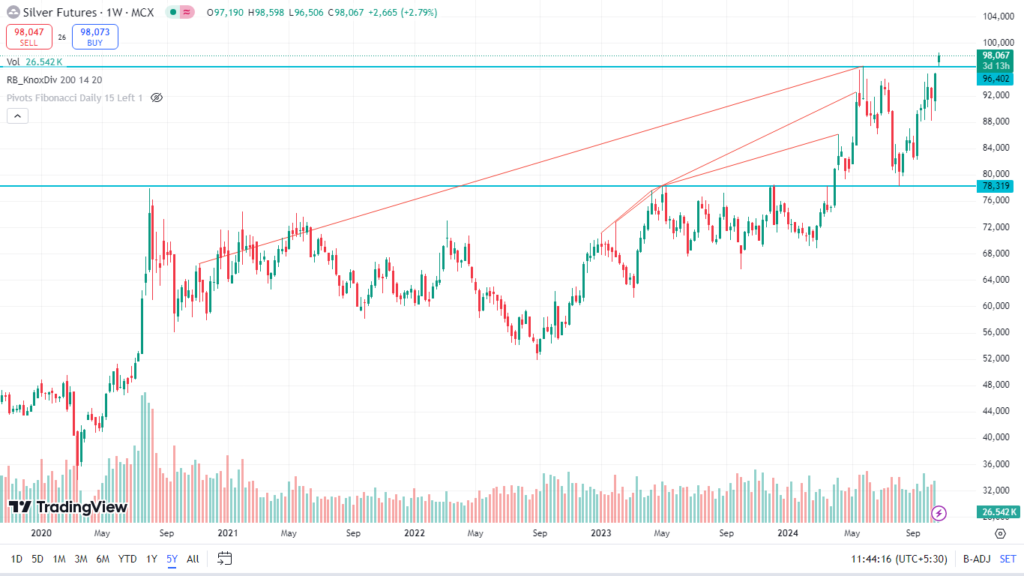
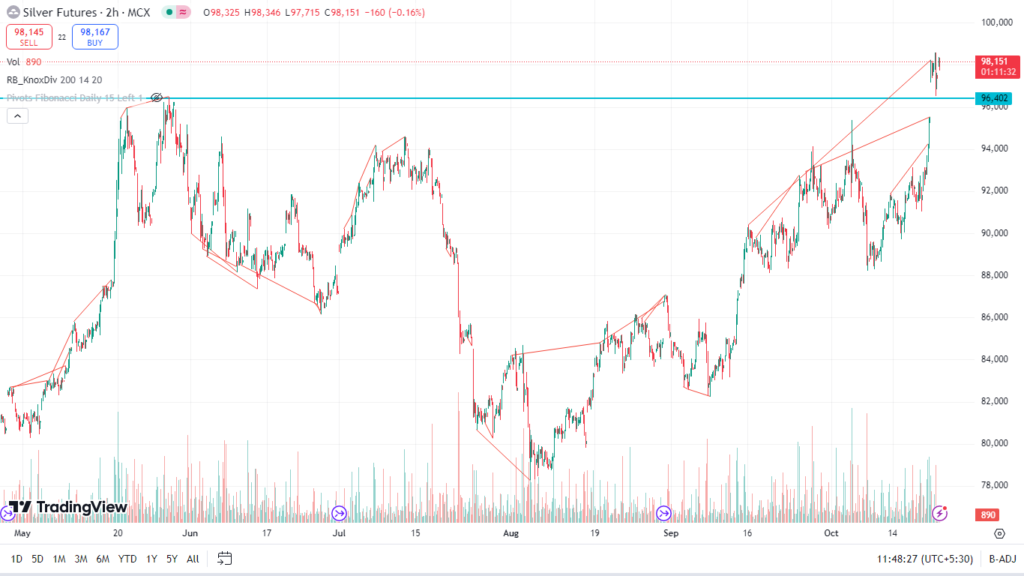
For silver, the resistance level sits near ₹75,000 per kilogram, while its support level is around ₹70,000.
2. Use Technical Indicators
Technical indicators such as moving averages, Bollinger Bands, and Relative Strength Index (RSI) can help confirm resistance and support levels. For example, if the price of gold touches a key moving average (like the 50-day or 200-day) and bounces back, this point can act as a strong support level.
Similarly, when RSI shows that gold or silver is overbought or oversold, it can help predict reversals at resistance or support points.
3. Watch for Volume Spikes
Volume is a critical indicator of market sentiment. A spike in trading volume near a support or resistance level can indicate whether the price will break through or reverse. For instance, if gold approaches a resistance level with a surge in trading volume, it might break past that resistance, indicating upward momentum. Conversely, if silver hits a support level with high volume, it’s likely to bounce back, signaling a buying opportunity.
Economic Factors Affecting Gold and Silver
Several economic factors influence gold and silver prices, which in turn affect their resistance and support levels.
1. Interest Rates and Inflation
Interest rates have a direct impact on gold and silver prices. When interest rates rise, the opportunity cost of holding non-yielding assets like gold increases, leading to a fall in prices. Conversely, during periods of low interest rates, demand for gold and silver tends to rise, pushing prices higher.
Currently, central banks globally are in a tightening phase, but inflation remains a concern. This is why gold and silver continue to hold firm at current levels.
2. U.S. Dollar Strength
Gold and silver prices often move inversely to the U.S. dollar. When the dollar strengthens, it becomes more expensive for foreign investors to buy dollar-denominated gold and silver, reducing demand and driving prices down. A weak dollar, on the other hand, typically pushes prices up.
The U.S. dollar has been strengthening due to rising interest rates, which has capped the upside for both gold and silver. Resistance levels have been tested but not broken as a result.
3. Geopolitical Tensions
Gold and silver are safe-haven assets, meaning their prices typically rise when there’s uncertainty in global markets. The ongoing geopolitical tensions in regions like the Middle East, coupled with economic instability, are keeping demand strong.
This heightened demand has created firm support levels for both metals, preventing prices from falling significantly.
The Relationship Between Gold and the Stock Market
Gold often has an inverse relationship with the stock market. When stock markets decline, investors flock to safer assets like gold, driving prices higher. However, in the current market environment, stocks have remained relatively resilient despite looming recession fears.
If the stock market experiences a significant downturn before the end of 2024, gold and silver could see a breakout above their current resistance levels.
Supply and Demand Factors
The supply of gold and silver also plays a crucial role in determining support and resistance levels. Limited mining output, geopolitical risks in major producing countries, and increasing industrial demand for silver (in electronics and renewable energy sectors) can push prices higher.
Meanwhile, central banks around the world have been increasing their gold reserves, particularly in countries like China and Russia. This has provided a strong demand base, helping to reinforce support levels.
Targets and Predictions for Gold and Silver in 2024
For gold, the next resistance target is ₹60,000 per 10 grams. If it breaks through this level, it could move toward ₹62,000. On the downside, support remains firm at ₹56,500.
For silver, the immediate resistance is ₹75,000 per kilogram, and if that’s surpassed, the next target could be ₹78,000. Support sits around ₹70,000.
What Should Investors Do?
Investors should watch key resistance and support levels closely. If gold or silver break through their resistance levels, it could signal a new bullish phase. On the other hand, if prices approach their support levels, it could provide a buying opportunity.
In the current economic climate, with inflationary pressures and geopolitical tensions still prevalent, both gold and silver offer attractive hedging opportunities against market volatility. By understanding these technical levels, you can better navigate the market and make informed investment decisions.
Conclusion
As you can see, identifying resistance and support levels for gold and silver is crucial for making smart trading and investment decisions. With a clear understanding of current economic factors, market conditions, and key price levels, you can confidently participate in these precious metal markets. Tracking global demand, central bank policies, and technical indicators will help you stay ahead and maximize your returns in 2024.
For more expert insights and up-to-date analysis on gold and silver, bookmark our website, and stay ahead of the market trends!